1. Measuring the elevational differences - We did not get the opportunity to measure the elevational differences However, if we did measure the levels we would have measured the elevational differences by using PCB pipes and reading the line levels that are marked on it. One pipe with markings on it would be tied to another pipe like it. Then you would take the numbers from the pipes and subtract them to get the elevation increase or decrease. One mark on the pipe equals one foot.
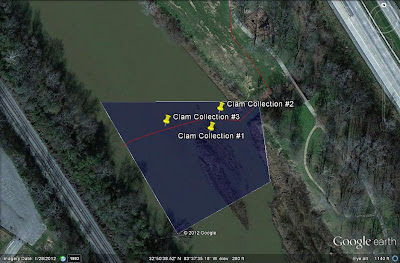
2. Measuring the relative amount of clams in river - We used a large crate with a metal screen in the bottom. We dug up some sand from different areas of the river and placed the sand in the crate. Then the sand was sifted through the metal screen, revealing the clams. Then the number of clams was counted and we took counts for different elevations to see the clam concentrations in certain types of areas (ex. deep underwater sand vs. island sand).
3. Measuring the river flow rate - We found a small object to float in the water. Then we spaced people out in even intervals to see how much time it took the object to reach each person. Then the object was allowed to float along the river, passing by the people. Then we calculated the speed by taking the distance and dividing it by the amount of time it took to cover that distance.
Our Ocmulgee River Experience
Ocmulgee River Data
My Ocmulgee River Elevation Graph
So our trip to the Ocmulgee River helped us to see how to measure different constructs by measuring the clam concentrations, the river flow rate, and the different elevational levels of the river. Knowing these things about the river is important because the Ocmulgee River is such an integral part of the environment.


