
Cartography
Choropleth Map

The chloropleth map is good for visualizing a measurement's variation across an particular area. In this map we see can see where there are many acres of orchids and also areas that do not have a lot of orchid acres.
Dot Density Map

The dot density map is useful because they can see spacial patterns of whatever the map looks to show. Each dot should be placed in a pinpoint location. It is also good in showing the concentration of something. For instance, in this map, we can see that the United States' harvested cropland in 1949 was mostly harvested in the Midwest.
Proportional Symbol Map
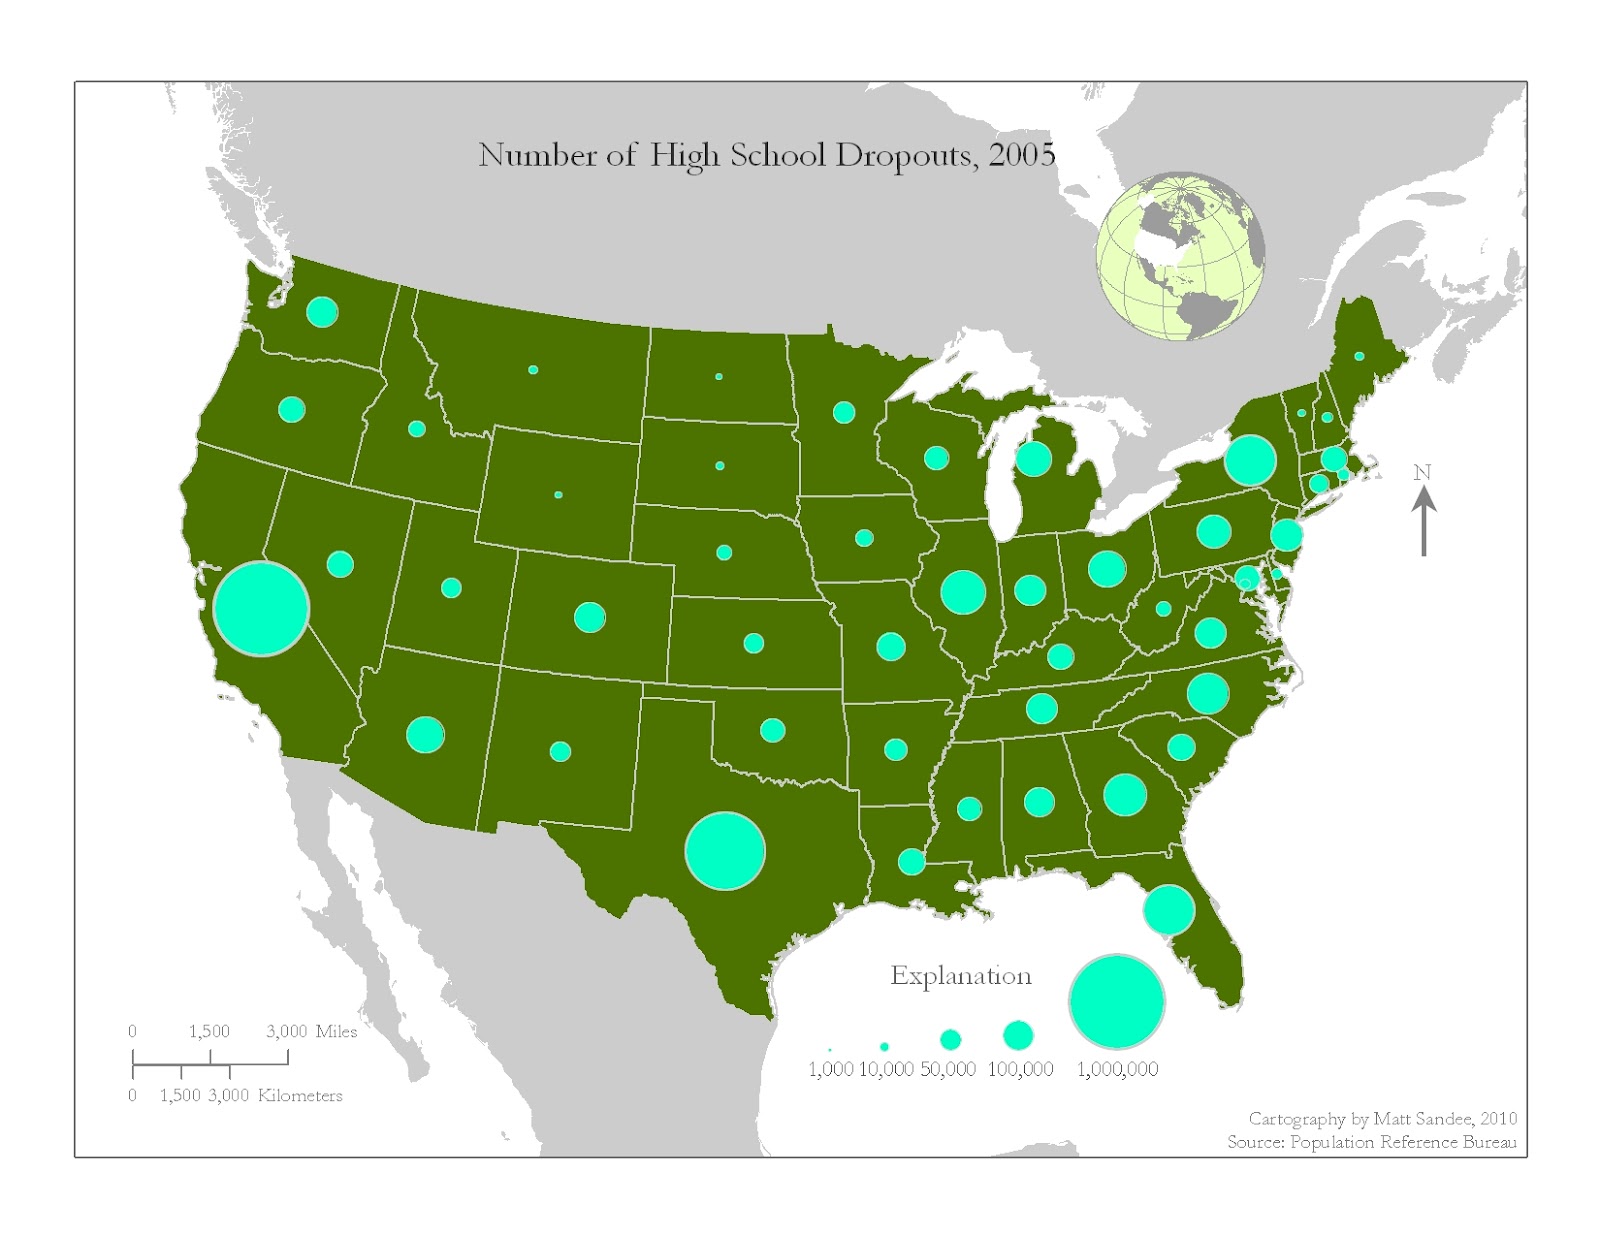
The proportional symbol map is used to show geographic information. Symbols on the map are generally not placed in pinpoint locations. In this map, we can see that the larger states have a higher number of high school dropouts.
Isopleth Map

Isopleth maps are good in showing a particular area's steepness as well as weather fronts that may be moving in an area. This map is unique because the lines are the focal point rather than dots, coloration, and symbols. In this example, we can see there are a few steep spots in the area and we can also see the elevations.
This is a link from the Weather Channel about Tropical Storm Leslie
No comments:
Post a Comment